
I did a basic performance test for my favorite test-automation workflow with an integrated FirePath. I distinguished two phases: duration to start the Firefox Browser and duration for executing a very typical testprogram against a common website. And here are my results:

The starting of a WebDriver-driven Firefox with an integrated FirePath costs in average about 20 seconds more than the starting of a „naked“ Firefox. In contrast the execution of the typical testprogram doesn’t show a significant difference in velocity. The few seconds difference are maybe caused by performance differences by the webserver of the tested website, anyhow not significant …
To say it very clear: 20 seconds more in the starting phase is nothing compared to the time we spend to navigate a different Firefox (not the driven Firefox) until we finally reach the point of disturbance and finally start to debug the xPath there. So enhance your test-automation workflow with an integrated FirePath!
Archiv für den Monat: Mai 2015
Better test-automation workflow with integrated FirePath
I appreciate the power of FirePath for coping with xPaths (compare XPath extensions for Chrome), so I like to have it debug-ready on the Firefox which I’m currently „driving“ while creating my testprograms. My ideal test-automation workflow: I set a breakpoint beside a suspicious line of code in my IDE, then I start the testprogram, the Firefox rises, I watch it clicking, typing, … and then the testprogram stops at my breakpoint. Many times a bad xPath is responsible for troubles, so now I like to rise the great FirePath on the halted Firefox and start debugging the bad xPath:

And here we go:
Finding the proper combination of the versions of Selenium-Server, Firefox, Firebug (required for Firepath) and Firepath can be a nightmare. I’m heavily missing an official table regarding the version of Selenium-Server and its supported browser versions. After some hours, I found one of these working combinations:
* selenium-server 2.34.0
* Firefox 25
* Firebug 1.12.8b1
* FirePath 0.9.7.1
Download Firefox, Firebug and FirePath in a separate folder to clearly separate them from your current Firefox instance. You can then explicitly start them by code (this example in Java):
        FirefoxBinary firefoxBinary = new FirefoxBinary(new File("C:\\Users\\michael\\Firefox v25\\firefox.exe"));

        FirefoxProfile profile = new FirefoxProfile();

        String pathToFirebugExtension = "C:\\Users\\michael\\Firefox v25 Extensions\\firebug-1.12.8b1-fx.xpi";

        profile.addExtension(new File(pathToFirebugExtension));

        String pathToFirepathExtension = "C:\\Users\\michael\\Firefox v25 Extensions\\firepath-0.9.7.1-fx.xpi";

        profile.addExtension(new File(pathToFirepathExtension));

        WebDriver driver = new FirefoxDriver(firefoxBinary, profile);
Then, when the Firefox stops at the breakpoint, you can press F12 (to open FireBug), click on the tab FirePath and start debugging the suspicious xPath.
My next article analyses the performance of the Firefox with the FirePath on his back: https://itkosmopolit.wordpress.com/2015/05/30/performance-test-of-integrated-firepath/
XPath Extensions for Chrome
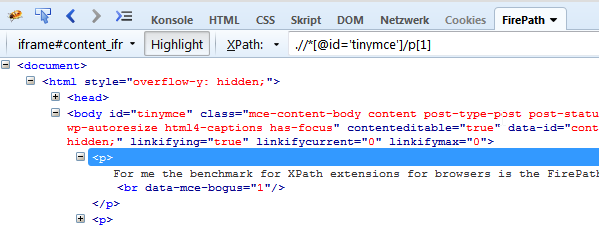
For me the benchmark for XPath tools is the FirePath for Firefox, which fits IMHO perfectly the needs of testautomation.
Criteria for a good xpath tool
1.) Showing the DOM (for good orientation)
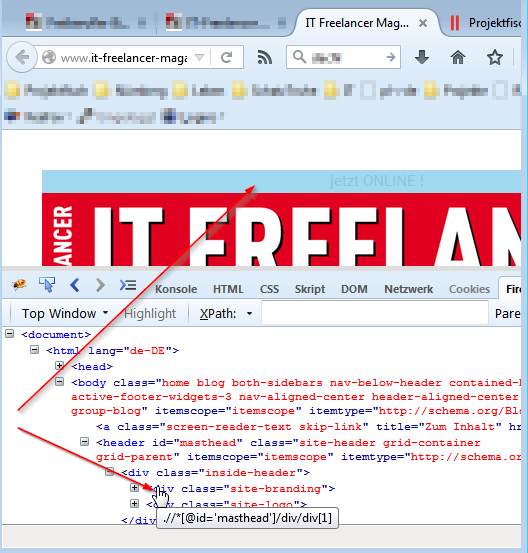
2.) Highlighting: The tool should highlight the element on the website, when hovering over the element in the DOM
3.) Syntax-Checker: Alert when xPath is invalid (in contrast to not finding an element)
Compare:

To:

4.) of course the basic stuff: usability, reliability (…)
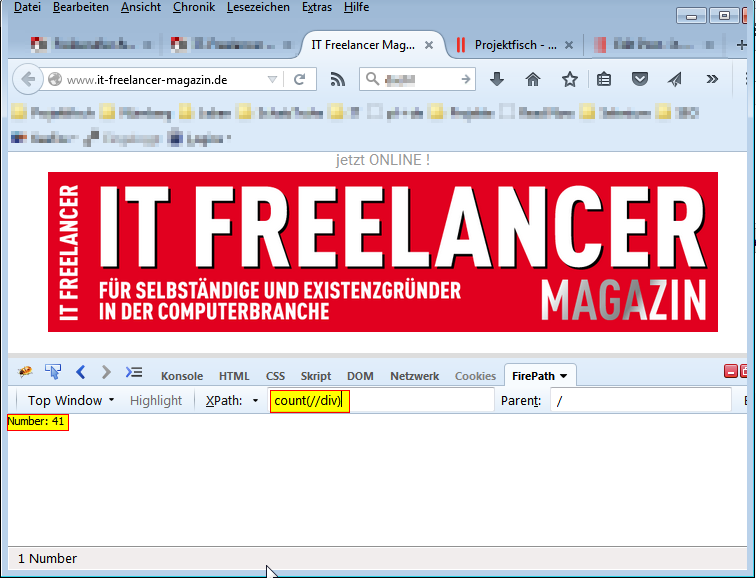
5.) Not only display node-types, but also number-types:
6.) Suggesting a proper xpath for an element (ideally it’s good enough to use it without modification):

Analysis of XPath Tools in Chrome
Now I’m looking for an equivalent for Chrome browser and found 3 xpath extensions in the Chrome Webstore:
1.Tool) XPath Helper
The XPath Helper is the most distributed extension with 250 feedbacks, so I installed this tool first. After you press ctrl+shift+x, the tool appears on the TOP of the viewport, which is unusual for me, but ok. Very nice is the handling, to get the xPath for an element: you just have to press shift, while hovering over the element. Also an invalid xPath is alerted well. But the suggested xpath is much too long, so must be modified by hand in every single case. Additionally I’m heavily missing the virtualisation of the DOM, like in FirePath.
While playing around, I quickly found a severe bug: This xPath „//*[@class=’gsfi‘]“ shows a match for this element: class=“gsfi xh-highlight“. Evil.
Summarized the XPath helper is no alternative to FirePath in Firefox.
2. Tool) XPath
The second choice with 96 feedbacks is „XPath“, which comes with the unattractive total rating of 2 of 5 stars, but let’s see. After installing it, it opens two tabs just for advertisement, which is not really sympatic, but let’s see. As claimed I clicked on the toolbar icon and then clicked an element. I did it very often, but nothing happens. To check if I’m too dumb to use it correctly, I read the ratings in the Chrome Webstore: many users facing the same simple problem: this tool just doesn’t work.
3. Tool) xPath Analyzer
The third choice with tiny 10 feedbacks is xPath Analyzer, but let’s give underdogs a chance. After installing I found, this tool also comes with an icon in the toolbar. Trying to use it on www.google.com I got an error: „This page does not contain an XML document.“ Not wasting much of my time, I estimate: this tool has no use for testautomation.
4. Tool) Build-in XPath Tool
Last chance to find an alternative to firebug in Chrome is asking stackoverflow: In this answer it’s indicated, that for Chrome the best choice is to use the build-in Chrome Developer Tools to cope with xPaths.
I found, the suggested xPaths are good. Anyhow, to get the xpath from an element is pretty inconvenient:
- First you have to „inspect the element“ via context menu.
- Then you have to „Copy XPath“
- Open the searching panel (Ctrl+F)
- and finally paste it manually in the DOM searching panel:

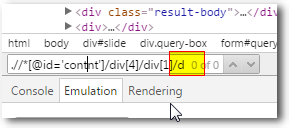
Unfortunately Developer Tools don’t tell me, if my xpath is invalid or just no element was found. This slows down the debugging. Another drawback in terms of usability is, that while writing the xPath, the focus in DOM may jump away. Also there’s a big minus in terms of usability, because for long XPaths, the textfield is to short:
5. Tool) XPath Viewer
This tool was updated in 2011 and since then it stays on version 0.2. I doubt, that this tool is developed further anymore. While testing I found a big bug: I could only find the element with XPath, when the element was in the viewport.
6. Tool) CSS and XPath checker

This tool doesn’t show the DOM and has no syntax-checker. Also there was no update since 3 years. I have no hope, that it’s still actively developed.
Conclusion
There’s no such thing like FireBug in Chrome ecosystem. However if you must use a xpath tool in Chrome use the build-in Chrome Developer Tools.
If you want to develop a proper XPath Tool for Chrome, please join in an existing project and don’t create your own. Don’t waist your valuable programming ressources.